Putting Harlem on the Map (Robertson) Fall 2011
Putting Harlem on the Map (Fall 2011 version)
¶ 1 Leave a comment on paragraph 1 0 Beginning in 1904, black New Yorkers relocated their residences, churches and businesses to the streets around the new subway station at 135th Street and Lenox Avenue in Harlem. Waves of African American migrants from the South and immigrants from the Caribbean joined them, creating a community in which blacks resided segregated from whites. By 1920 the area occupied almost exclusively by blacks stretched south to 130th Street, north to 144th Street, from Fifth Avenue across to Eighth Avenue, and encompassed a population of some 73,000 people. In the next decade Harlem became the ‘Negro Mecca,’ a more cosmopolitan place than America’s other ‘black metropolis,’ Chicago, one deserving of the title of the world’s black capital. By 1930, blacks, now numbering around 200,000, had spilled over Eighth Avenue to Amsterdam Avenue, and were living as far north as 160th Street, and approaching 110th Street to the south. But, of course, it was about more than simply size or numbers. Harlem was home to the political and cultural leaders of black America: the New York Urban League and Garvey’s United Negro Improvement Association (UNIA) had their headquarters there; writers Langston Hughes, Wallace Thurman, and Zora Neale Hurston all lodged in the same building; and Duke Ellington and Ethel Waters performed in the neighborhood’s clubs and theatres.1
¶ 2 Leave a comment on paragraph 2 0 That picture of Harlem is in line with those you would find setting the scene for most studies of the neighborhood, or offering a snapshot in some broader account. After six years of using digital geospatial tools to study Harlem, I’m struck by how much it omits, and how little sense of the place it conveys. If urban history is defined by a concern with particular places and spaces, it has long been satisfied with a large scale or very selective treatment of physical locations. Certainly, when three colleagues and I conceived a collaborative study of everyday life in Harlem in the 1920s, we largely took the place as a given. Our central concern was to identify ordinary blacks, residents other than those familiar from the ever-expanding literature on the Harlem Renaissance and the beginnings of the civil rights movement. In fact, only when we headed to the archives did we even confront having to precisely define the neighborhood’s boundaries.2
¶ 3 Leave a comment on paragraph 3 0 The digital tools we used to manage what we found in the archives changed how I thought about Harlem. Our core sources consisted of almost three thousand case files containing accounts of crimes by or involving blacks, and hundreds of pages of black newspapers. I had used a simple Filemaker database to organize similar material in a previous project, and had proposed we develop a more sophisticated online database for this material, so all the collaborators could share and use it. In addition, since our research concerned a neighborhood, and legal records almost invariably include information on locations, I envisioned that database as linked to maps. Geographic Information Systems (GIS) offered that combination of a database and a mapping system, and with only a general idea of how such software worked and what it could do, I imagined using it to recreate several key blocks in Harlem. It was 2002, when the existing historical GIS projects employed desktop ArcGIS software developed for social scientists, relied on quantitative data and could not easily be shared online.3 However, the designers and programmers who we employed, from the University of Sydney’s Archaeological Computing Laboratory (now Arts eResearch), offered us a different approach. When they constructed our database, in 2006, as a temporary fix they linked it to Google Maps, made available online only a year earlier, to allow me to create preliminary maps of our evidence. As we grappled with a raft of design and technical challenges, it became clear that this simplified, web-based form of GIS would serve the purposes of the project, and Digital Harlem became one of the first scholarly sites to employ what has become known as the geospatial web.4
¶ 4 Leave a comment on paragraph 4 1 GIS organizes and integrates sources on the basis of their shared geographic location, which in the case of an urban setting means their street address. Working with addresses involved thinking about Harlem on a much smaller scale than had other scholars.5 Maps in existing historical studies focused on showing the boundaries of the area dominated by black residents and the location of a handful of landmarks, at a scale that located Harlem in upper Manhattan, the area above Central Park. With a street map as the background, the area around the boundaries and landmarks appeared only as undifferentiated space. 6 Examples of such maps can also be found online: Social Explorer offers maps of the distribution of New York City’s black population using historical census data; and Drop Me Off in Harlem, a site created by the Kennedy Center’s Education Department, includes a map of landmarks in the neighborhood.7 To fill the spaces in these maps, to recreate Harlem at the scale of individual addresses, I turned to a real estate atlas from 1930, from which the ACL eventually created a map to overlay on Google Maps. Real estate maps include the footprints of buildings, with information on how many floors high they stood, on the materials from which they were constructed, and on the presence of elevators and stores.8 In other words, these maps literally fill in the blocks of the street map, helping, as Ian Gregory and Paul Ell put it, to “subdivide the place under study into multiple smaller places and give some indication of how these places interact.”9 Thinking about Harlem at this scale, you are immediately confronted with how imprecisely most historical scholarship treats location: events and buildings are not given an address, or given only a partial or incorrect address, and little attention is paid to how that location is related to other places, to what is proximate or distant. It is enough to say that the places mentioned are somewhere in Harlem.
¶ 5
Leave a comment on paragraph 5 0
 Figure 1: Detail from Atlas of the City of New York, Borough of Manhattan, Vol. 4 (G. W. Bromley & Co., 1932), Digital Harlem, accessed August 10, 2011 http://acl.arts.usyd.edu.au/harlem/
¶ 6 Leave a comment on paragraph 6 0 Examining Harlem at a smaller scale involved me in what Karen Halttunen identified as the second wave of the spatial turn in humanities scholarship, the move from constructing a spatial analysis that “tended to the metaphorical” and employed the “idiom of borders and boundaries, frontiers and crossroads, centers and margins,” to a concern with “spatial issues more materially.”10 You could argue that my work is spatial history not digital history, but that would ignore the extent to which such mapping is not just enabled by digital tools, but really only possible when you use such tools. Real estate maps are so small in scale that they cannot be reproduced in print publications, with those covering Harlem amounting to almost an entire atlas volume. However, digitized and overlaid on Google Maps, real estate maps become scalable, making it possible to zoom out from individual buildings to the neighborhood view favored in historical maps of Harlem, and to an even larger scale that situates upper Manhattan in the larger city.
¶ 7
Leave a comment on paragraph 7 0
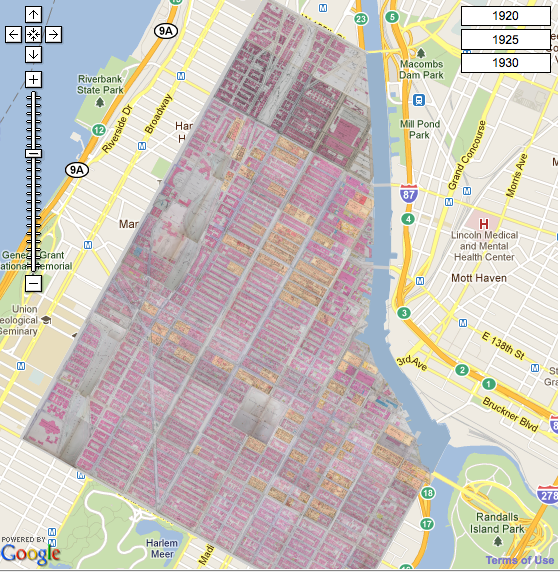 Figure 2: Real Estate Map Overlay, Digital Harlem, accessed August 10, 2011, http://acl.arts.usyd.edu.au/harlem/
¶ 8 Leave a comment on paragraph 8 1 Geospatial tools involve not only maps but also databases. The power of such tools is that they use geographic location to integrate material from a wide range of disparate sources. “What is important about assigning a geographic reference to data,” Karen Kemp points out, “is that it then becomes possible to compare that characteristic, event, phenomenon, etc. with others that exist or have existed in the same geographic space. What were previously unrelated facts become integrated and correlated.”11 The sources that feature in Digital Harlem are qualitative records rather than the quantitative data traditionally used in GIS. Few other attempts have been made to use the technology to analyse such sources. The two most prominent examples are Valley of the Shadow, which maps railroads and roads, agricultural production and farm values, households owning slaves, voting and the location of churches, in order to compare two communities in the era of the Civil War, and the Salem Witch Trials Documentary Archive, which maps only witchcraft accusations.12 What distinguishes Digital Harlem from those sites is not only its sources–legal records and newspapers–but also that the database contains all the material in the sources that is associated with an address. In other words, the geospatial database allowed us to incorporate and organize a range of material that historians typically treat as ephemera, or pass over it as too sparse or fragmentary to support an analysis. At the same time, the need for a location excluded some material; every newspaper issue included some stories that did not include an address, particularly reports from the Magistrate’s Court. So, as much as the database offered a way to bring together a wide range of material, it was not a means of creating a ‘total history,’ a complete cross-section of everyday life.
¶ 9
Leave a comment on paragraph 9 0
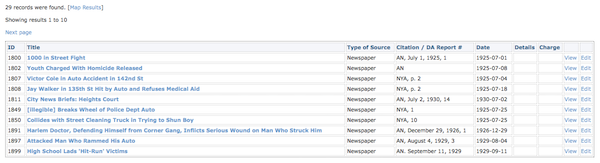 Figure 3: Database Search Results, Event Type=”Automobile Crash” Digital Harlem
¶ 10 Leave a comment on paragraph 10 1 In making it possible to place the contents of a database on an online map, GIS takes advantage of one of the core properties of the digital medium, that it is visual, an aspect that historians have been slow to develop, exploit and make integral to historical analysis.13 As Trevor Harris, Jesse Rouse and Susan Bergeron argue, “The visual display of information creates a visceral connection to the content that goes beyond what is possible through traditional text documents.”14 (That contrast is evident in a comparison of how traffic accidents appear in the database (figure 3) and displayed on the map (figure 5)). It is not just that mapped data is seen in its geographical context. Layers of different data, and hence large quantities of data, can be combined on a single map, providing an image of the complexity of the past. You can examine maps of sources at different scales, and “discover relationships…by visually detecting spatial patterns that remain hidden in texts and tables.”15 Those spatial relationships prompted questions I might otherwise have ignored and facilitated comparisons that I would not have considered. But there are definite limits to the visualizations created by Digital Harlem, and GIS in general. As Ian Gregory notes, “They provide a simple summary of the distribution of a variable in ways that attempt to stress the spatial by simplifying attribute [the characteristics recorded about entities in the database] and fixing time.”16 The patterns evident on these maps reveal ‘where,’ in the process asking, but not explaining, ‘why there?’ Nonetheless, pursuing answers to such questions changed the way I thought about Harlem’s past, and gave me a different perspective on the neighborhood.
¶ 11
Leave a comment on paragraph 11 0
 Figure 4: Nightclubs, Speakeasies and Buffet Flats (Search Places, Location Type=”Nightclub” + Location Type=”Speakeasy” + Location Type=”Buffet Flat”, Digital Harlem, accessed August 10, 2011, http://acl.arts.usyd.edu.au/harlem/)
¶ 12 Leave a comment on paragraph 12 0 One example of the new perspective Digital Harlem offers is this map of Harlem’s nightlife, which includes layers showing the neighborhood’s nightclubs, the speakeasies that became ubiquitous during Prohibition, and the buffet flats black residents set up as an alternative to those venues. Most attention has been directed at the nightclubs, for which there are a range of sources. Speakeasies are also a well-recognized presence, but their locations have been discussed only in general terms. However, we found lists of addresses in the New York Age, published as part of the editor’s efforts to get the authorities to close them. Buffet flats attract only a passing mention by scholars, but they became a concern for reformers at the end of the 1920s, and in 1928, the target of an undercover investigation by the Committee of Fourteen, a white anti-prostitution organization. Combining these sources shows that these nightlife venues had very different geographies. Nightclubs, many of which predated Prohibition, clustered around 135th Street and on and east of Seventh Avenue, scattered from the core of black settlement toward the areas of white population. Speakeasies could be found far more widely throughout Harlem, mostly on the avenues, in storefronts, including on Eighth Avenue, which had no other nightlife, with clusters in the vicinity of nightclubs, where they drew many of the same mix of black and white patrons. Buffet flats likewise operated at more widely scattered locations than nightclubs, but most were on cross streets not avenues, with many above 140th Street, a largely residential district distant from whites. Where whites owned most nightclubs and speakeasies, blacks operated the buffet flats, in their own homes, thereby extending some of the privacy of a residence to their almost exclusively black patrons. Mapping nightlife thus helps identify an unrecognized black response to Prohibition’s impact on the Harlem: the creation of places apart from the whites who appeared in increasing numbers in the neighborhood’s nightlife.17
¶ 13
Leave a comment on paragraph 13 0
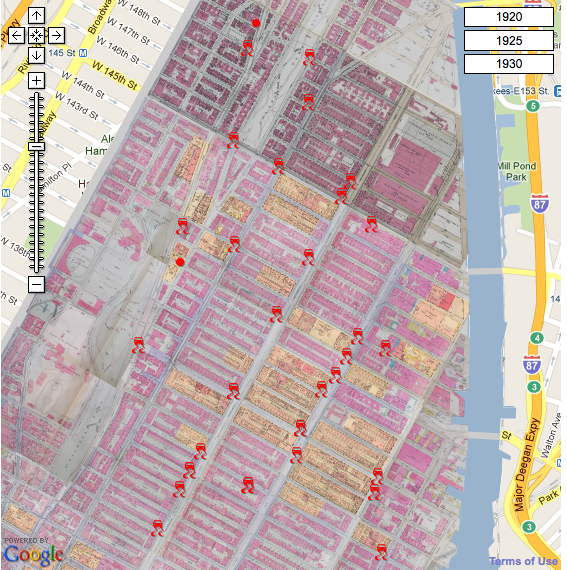 Figure 5: Traffic Accidents (Search Events, Type of Event=”Automobile crash,” Digital Harlem, accessed August 10, 2011, http://acl.arts.usyd.edu.au/harlem/)
¶ 14 Leave a comment on paragraph 14 0 Traffic accidents offer another example of how Digital Harlem changed how I thought. In the first instance, I would not have paid attention to these incidents if I had not been entering every event that had a location into the database. Reports of accidents appeared regularly in black newspapers, but usually amounted to no more than a few sentences. A map of that information (figure 5) showed accidents throughout the neighborhood, concentrated on Seventh and Lenox Avenues, which ran north-south the length of Harlem. These avenues have long been recognized as occupying a central place in Harlem life. Christened the ‘Black Broadway’ by writer Wallace Thurman, Seventh Avenue featured the theatres and nightclubs and speakeasies visited by thousands each evening in the late 1920s, and many of Harlem’s major churches, which drew large crowds each Sunday. On the sidewalks of both avenues, individuals went ‘strolling,’ donning their best clothes took to display their style, to socialize with friends and to meet strangers. Men and women collecting bets on the numbers occupied the corners each weekday morning, replaced in the evenings by prostitutes. On weekends, residents paraded in the avenues themselves, with their fraternal lodges, as members of the UNIA or in funeral processions.18 However, in addition to these well-known activities, the two avenues saw more traffic than any other roadway north of 59th Street, most of it travelling through the neighborhood en route in and out of the city, joined in the evening by fleets of taxis bringing visitors to Harlem’s nightlife. At the intersections with 135th Street, that traffic met waves of vehicles trying to travel across town, producing traffic ”so heavy,” the Amsterdam News editorialized in May 1923, “that is dangerous to venture to cross the street at that point.”19 Public transport also ran on both avenues: street cars travelled on Lenox from 116th to 148th Street, and double-decker buses ran on Seventh from 110th to 155th Street.
¶ 15 Leave a comment on paragraph 15 0 Accidents revealed an overlooked facet of life in the neighborhood, and recast the context and meaning of what happened on the avenues. Whites made up most of those driving on Harlem’s streets, behind the wheel of private cars, buses and streetcars. As a result, traffic accidents often produced interracial encounters, conflict and occasionally violence. Efforts to better control the traffic in some cases exacerbated that conflict. When traffic police were eventually stationed at the most dangerous intersections, they included black officers, whose direction of white drivers often attracted crowds of blacks, and enough controversy that the Police Department refused to appoint them to posts on 125th Street, where many pedestrians as well as drivers would have been white.20 In the context of the white presence in the street, and the white ownership of the businesses lining the avenues, when blacks paraded, strolled the sidewalks and spoke on the street corners they effectively contested white dominance of the avenues, and claimed those places for themselves. That such racial contests for space took place within Harlem made me pay more attention to the white places in what I had thought of as simply a black neighborhood. Not only did there prove to be a more extensive white presence than the passing mentions in the historiography implied, but, as I argue in a forthcoming article, it was more contentious, introducing the racial negotiation, resistance, and accommodation that characterised the rest of the city into some places in Harlem itself, taking away from the respite that the neighborhood offered blacks.21
¶ 16
Leave a comment on paragraph 16 0
 Figure 6: An Individual Life: Morgan Thompson (Search People, First Name=“Morgan” and Surname=”Thompson”, Digital Harlem, accessed August 11, 2011, http://acl.arts.usyd.edu.au/harlem/)
¶ 17 Leave a comment on paragraph 17 2 While mapping traffic accidents made me aware of the white presence in Harlem, visualizing the lives of individuals gave me a new sense of how blacks moved around the neighborhood and the wider city. Digital Harlem uses lines to mark two kinds of temporal relations, to link sequences of locations at which events like parades took place, and to link an individual’s residence with locations where she or he spent time while living at that address. The richest pictures of individual lives are contained in Probation Department files, whose subjects reported their activities on a weekly basis for up to five years. Maps of their lives highlight the distance they had to travel to work, and how often many changed their residence. Morgan Thompson, a West Indian on probation after he lost his temper and stabbed a man who had confronted his seventeen-year-old son, worked as a laborer for construction contractors. Between 1928 and 1933 that work took him to fifteen different constructions sites, in downtown Manhattan and on the Upper East Side, and in the outer boroughs of Brooklyn, Queens and the Bronx. Only once did he work in Harlem, on the new 135th Street YMCA (figure 6).22 Maps also identify other largely unexplored occasions when blacks had to move through the city, including to attend sporting events. While basketball games took place in Harlem’s dancehalls and church community houses, cricket and baseball games involving black teams took place in Washington Heights and the Bronx.23
¶ 18 Leave a comment on paragraph 18 0 Within Harlem, while Morgan Thompson and his family lived at the same address on West 144th Street for over a decade, many black families regularly relocated. Perry Brown, a forty-five year old on probation for stealing coats to pay for his wife’s medical care, relocated five times in three years, not simply to get better housing but sometimes to get rooms to lease to boarders, or premises easier for his wife to maintain, or when he could not pay the rent.24 The variety of apartments Brown and his wife occupied highlights the range of housing that existed in Harlem beyond the overcrowded tenements and middle class dwellings that typically draw attention. Moreover, for all the upheaval attending relocation, mapping the Browns’ homes highlights that for Harlemites moving generally only involved shifting a few blocks, with little likely disruption of their relationships and involvement in the community.
¶ 19 Leave a comment on paragraph 19 1 Working with Digital Harlem also led me to write in a different form, a blog. This online writing is typically seen primarily in terms of length, as a short form, but what shaped my blogging was its relationship to other forms of digital history and historical writing. In the first instance, blogging provided a way to supplement Digital Harlem. As the maps created on the site by their very nature raise questions rather than answering them, they could not simply stand on their own online. Digital Harlem required additional context; a blog provided a medium linked to the site in which to tell stories about the maps. In addition, Digital Harlem’s maps are difficult to incorporate into print publications: dynamic maps have to become static, without scalability or links to the database of sources; and colored visualizations have to be reproduced in black and white, limiting the layers and quantity of data that can be included. Included in a blog, screenshots of the maps retain their color and can be linked to the site. They also can be supplemented with images, which are not currently in the database and for which space is limited in print publications. The blog posts thus can also provide a form of footnote to traditional published writing, where I can elaborate in more detail a topic that there is only space to touch on in a print article. Relative to a published footnote, the blog is a longer form. Obviously, online the blog can serve both as a context for Digital Harlem and as a reference for a print publication.
¶ 20 Leave a comment on paragraph 20 0 The blog post “Traffic accidents in 1920s Harlem,” for example, both provides context for a map and an extension of an argument in a forthcoming article. The 784-word post describes the broad pattern of accidents, the character of the traffic on Lenox and Seventh Avenues, traffic police posts and the reactions to black officers, and an example of the racial conflict that some accidents produced. It includes screenshots of a map of accidents, and that map with traffic police posts added (with instructions on how to create the maps in Digital Harlem), together with photographs of children crossing the street, and Officer Reuben Carter directing traffic. The article that will link to the post includes two paragraphs focused on the racial conflicts that occurred as a result of accidents, but no maps or photographs, only brief mentions of the broader patterns of accidents and no discussion of the origins of the traffic police posts.25 The posts on individual lives take a slightly different approach to elaborating what can be gleaned from the map. In writing about Perry Brown, I drew on his probation file to craft a narrative of this slice of his life, and used his membership of a fraternal lodge as a way into a broader discussion of lodges in Harlem, with a map of their locations, a photograph of members of one Elks lodge and an image of the Imperial Elks’ Hall. In this case, the post does not serve as an elaborated footnote; our published analysis of Brown’s life is considerably more detailed, but it lacks the maps and images incorporated in the post. Approached from the published article (or via a search engine), posts thus serve a mediating function, offering static screenshots that link to Digital Harlem, where dynamic maps can be recreated and explored.26
¶ 21 Leave a comment on paragraph 21 0 Approaching 1920s Harlem through the maps created by Digital Harlem, using the the tools offered by the geospatial web, has literally caused the way I think about the neighborhood to go through a spatial turn. Maps of the variety of sources my colleagues and I have gathered confront me with the multiple places that made up Harlem and the wide variety of events that took place there. Trying to understand those maps draws me down to the level of individual places, and to the relations between them, into the web of locations in which individuals lived their lives, where they resided, worked and spent their leisure time. Used in this way, the geospatial web can capture “the confluence of multiple rhythms” that Henri Lefebvre argued make up everyday life, offering a new perspective on what it was like to live in Harlem.27
¶ 22 Leave a comment on paragraph 22 0 About the author: Stephen Robertson is Associate Professor of History in the Department of History at the University of Sydney. In addition to his work on everyday life in 1920s Harlem, he has published on the history of sexual violence and is currently working on a history of undercover surveillance in the US from 1865-1940, and collaborating with Shane White and Stephen Garton on a project called “Year of the Riot: Harlem, 1935,” which will extend Digital Harlem into the 1930s.
¶ 23 Leave a comment on paragraph 23 0 Acknowledgement: Digital Harlem exists thanks to an Australian Research Council Discovery Grant (DP0343148), on which I collaborated with Shane White, Stephen Garton and Graham White, all colleagues from the Department of History at the University of Sydney, and all due thanks for gathering the sources used in the project and for supporting the development of the site.
- ¶ 24 Leave a comment on paragraph 24 0
- Gilbert Osofsky, Harlem: The Making of a Ghetto, 2nd ed. (New York: Harper Collins, 1971), xvi; James Weldon Johnson, Black Manhattan (New York: Da Capo Press, 1991 (1930)), 147; David Levering Lewis, When Harlem Was in Vogue (New York: Penguin, 1981), 193-94; Jervis Anderson, This Was Harlem: 1900-1950 (New York: Farrar Straus & Giroux, 1981), 128, 174, 236. ↩
- For details of this research project, see “Black Metropolis: Harlem 1915-1930,” accessed August 12, 2011, http://sydney.edu.au/arts/history/research/projects/harlem.shtml. ↩
- Ian Gregory and Paul Ell, Historical GIS: Technologies, Methodologies and Scholarship (Cambridge: Cambridge University Press, 2007), 1-19, 89-90; Anne Kelly Knowles, “GIS and History,” in Placing History: How Maps, Spatial Data and GIS are Changing Historical Scholarship, ed. Amy Hillier and Anne Kelly Knowles (Redlands, CA: ESRI Press, 2008), 2-7; David Bodenhamer, “History and GIS: Implications for the Discipline,” in Placing History: How Maps, Spatial Data and GIS are Changing Historical Scholarship, ed. Amy Hillier and Anne Kelly Knowles (Redlands, CA: ESRI Press, 2008), 222-230. ↩
- Damien Evans took the lead in designing our database and site, and later, Andrew Wilson created the overlay map. See “Arts eResearch,” accessed August 12, 2011, http://sydney.edu.au/arts/eresearch/. On the geospatial web, see Muki Haklay, Alex Singleton and Chris Parker, “Web Mapping 2.0: The Neogeography of the GeoWeb,” Geography Compass 2, 6 (2008): 2011-2039; and Trevor Harris, Jesse Rouse and Susan Bergeron, “The Geospatial Semantic Web, Pareto GIS, and the Humanities,” in The Spatial Humanities: GIS and the Future of Humanities Scholarship, ed. David Bodenhamer, John Corrigan and Trevor Harris (Bloomington: Indiana University Press, 2010), 124-142. ↩
- Irma Watkins-Owens does include an analysis of the residents of a single block in her study of West Indians in Harlem; see Irma Watkins-Owens, Blood Relations: Caribbean Immigrants and the Harlem Community, 1900-1930 (Bloomington: Indiana University Press, 1996). ↩
- Johnson, 147; Osofsky, xv-xvii; Cheryl Lynn Greenberg, “Or Does It Explode?” Black Harlem in the Great Depression (New York: Oxford University Press, 1991), i; Stephen Watson, The Harlem Renaissance: Hub of African-American Culture, 1920-1930 (New York: Pantheon, 1995). ↩
- “Social Explorer – Demographic Maps,” accessed August 12, 2011, http://www.socialexplorer.com/pub/maps/map3.aspx?g=1&animation=true; “Drop Me Off in Harlem: A Place Called Harlem,” ARTSEDGE, accessed August 12, 2011, http://artsedge.kennedy-center.org/interactives/harlem/place.html. ↩
- For a key to the real estate map, see “The Map,” Digital Harlem Blog, accessed August 12, 2011, http://digitalharlemblog.wordpress.com/digital-harlem-the-site/the-map/. ↩
- Gregory and Ell, 185. ↩
- Karen Halttunen, “Groundwork: American Studies in Place – Presidential Address to the American Studies Association, November 4, 2005,” American Quarterly 58, 1 (March 2006): 2. ↩
- Karen Kemp, “Geographic Information Science and Spatial Analysis for the Humanities,” in The Spatial Humanities: GIS and the Future of Humanities Scholarship, ed. David Bodenhamer, John Corrigan and Trevor Harris (Bloomington: Indiana University Press, 2010), 32. ↩
- “Valley of the Shadow: Maps and Images, Augusta County,” accessed August 12, 2011, http://valley.lib.virginia.edu/VoS/maps/augustamaps.html and “Valley of the Shadow: Maps and Images, Franklin County,” accessed August 12, 2011, http://valley.lib.virginia.edu/VoS/maps/franklinmaps.html; “Salem Witch Trials Documentary Archive,” accessed August 12, 2011 http://fisher.lib.virginia.edu/libsites/salem/. For discussions of these sites, see Gregory and Ell, 195-98; and Knowles, 5-6. ↩
- See “Interchange: The Promise of Digital History,” Journal of American History 95, 2 (September 2008): 484. ↩
- Harris, Rouse and Bergeron, 130. ↩
- David Bodenhamer, John Corrigan and Trevor Harris, “Introduction,” in The Spatial Humanities: GIS and the Future of Humanities Scholarship, ed. David Bodenhamer, John Corrigan and Trevor Harris (Bloomington: Indiana University Press, 2010), vii. ↩
- Gregory and Ell, 94. ↩
- Stephen Robertson, “Harlem Undercover: Vice Investigators, Race and Prostitution in the 1920s,” Journal of Urban History 35, 4 (May 2009): 486-504; Stephen Robertson, “Harlem Undercover – the maps,” Digital Harlem Blog, http://digitalharlemblog.wordpress.com/2009/04/17/harlem-undercover-the-maps/; Stephen Robertson, Shane White and Stephen Garton, “Disorderly Houses: Residences, Privacy, and the Surveillance of Sexuality in 1920s Harlem,” Journal of the History of Sexuality (forthcoming 2013); ↩
- Wallace Thurman, “Negro Life in New York’s Harlem: A Lively Picture of a Popular and Interesting Section” (1927), in The Collected Writings of Wallace Thurman, ed. Amritjit and Daniel M Scott III (New Brunswick, NJ: Rutgers University Press, 2003), 40-41; Anderson, 319-323. ↩
- “Street Accidents,” Amsterdam News, May 16, 1923. ↩
- Stephen Robertson, “Traffic Accidents in 1920s Harlem,” Digital Harlem Blog, http://digitalharlemblog.wordpress.com/2010/04/01/traffic-accidents-in-1920s-harlem/. ↩
- Stephen Robertson, Shane White and Stephen Garton, “Harlem in Black and White: Race and Place in the 1920s,” Journal of Urban History (forthcoming 2012) ↩
- Court of General Sessions Probation Department Case File (PDCF), 11076 (1928) (Municipal Archives). We have employed pseudonyms for individuals on probation, as required by Municipal Archives. See also Stephen Robertson, “Morgan Thompson – a West Indian Laborer’s Life in Harlem,” Digital Harlem Blog, http://digitalharlemblog.wordpress.com/2009/12/01/morganthompson/; and Stephen Robertson, Shane White, Stephen Garton and Graham White, “This Harlem Life: Black Families and Everyday Life in the 1920s and 1930s,” Journal of Social History 44, 1 (2010): 97-98, 100-4. ↩
- Harlem lost its baseball ground, Olympic Field, in 1920, to redevelopment. On baseball, see Stephen Robertson, “Harlem and Baseball in the 1920s,” Digital Harlem Blog, http://digitalharlemblog.wordpress.com/2011/07/27/baseball-1920s-harlem/ ↩
- PDCF 15872 (1930); Stephen Robertson, “Perry Brown: A Lodge member’s life in Harlem,” Digital Harlem Blog, http://digitalharlemblog.wordpress.com/2010/07/15/perry-brown-lodge-member/; Robertson, et al, “This Harlem Life,” 104-8. ↩
- Robertson, “Traffic Accidents;” Robertson, White and Garton, “Harlem in Black and White.” ↩
- Robertson, “Perry Brown;” Robertson, et al, “This Harlem Life,” 104-8. ↩
- The description of Lefebvre’s argument is from Stefan Kipfer, Kaniska Goonwardena, Christian Schimd and Richard Milgrom, “On the Production of Henri Lefebvre,” in Space, Difference, Everyday Life: Reading Henri Lefebvre, ed. Kaniska Goonwardena, Stefan Kipfer, Richard Milgrom and Christian Schimd (New York: Routledge, 2008), 15. ↩

This is really cool (please excuse the colloquial phrase). It would be particularly interesting to hear your thoughts on the intersection of time and place on the map and the ways in which visualizing time (which I know the folks at the ACL have had a serious interest) on a spatial scale.
When do accidents occur? When do crimes occur? Does this vary spatially?
A note from the editors: For additional commentary on this essay, please see the page for general comments on the book.
This is a very useful article for urban historians. Thank you for including it.
This is very interesting and exciting. I can imagine this extending and having wider popular utility. For example one might be able to click on one’s home, school or workplace, and see its past, all about the people who’d lived there the things that had gone on there. One might also be able gain a greater, more accessible and interactive insight into one’s ancestors’ lives according to where they lived and worked etc.
I wonder, in terms of extending the project, what your thoughts are on the potential for using crowd-sourced material, perhaps in a similar ways to that outlined in Graham, Massie and Feuerherm’s and Sikarskie’s essays…?
The whole essay is splendid in that it demonstrates rather than simply professes the impact of new media on historical analysis and interpretation. I especially appreciate the way the specificity of the findings and methods shown frame the author’s discussion of blogging — which is itself nicely presented as continuous with other forms.
In our invitation to revise & resubmit your essay, we wrote:
We support the valuable public comments garnered by this essay, and concur with Bethany Nowviskie’s remark: “The whole essay is splendid in that it demonstrates rather than simply professes the impact of new media on historical analysis and interpretation. I especially appreciate the way the specificity of the findings and methods shown frame the author’s discussion of blogging — which is itself nicely presented as continuous with other forms.”
When drafting your revisions, we encourage you to specifically address the question about using legal records as source materials for everyday life, as you already discussed in your comment here:
“I elaborate my approach to using legal records for social and cultural history in “What’s Law Got to Do With It? Legal Records and Sexual Histories,” Journal of the History of Sexuality 14, 1/2 (January/April 2005): 161-85. We discuss what can be gleaned about everyday life from Probation Department files in our “This Harlem Life: Black Families and Everyday Life in the 1920s and 1930s,” Journal of Social History, 44, 1 (Fall 2010): 97-122.
Those articles do not explicitly address the spatial data found in legal records and how that can be used – that is what I’d hoped ‘Putting Harlem on the Map’ did. Given the chance to revise it, I’d probably more explicitly address the common misapprehension that legal records are only about crime, but I thought for this volume the focus should be on new possibilities for spatial history more than debates about the everyday – which we ground not simply in volume of sources, as Davarian implies, but also in diversity of sources.”
Furthermore, it would be ideal if you could share your thoughts regarding two other questions that arose in the comments, especially since they tie into other essays in the volume:
First, William Caraher asked:
“It would be particularly interesting to hear your thoughts on the intersection of time and place on the map and the ways in which visualizing time (which I know the folks at the ACL have had a serious interest) on a spatial scale. When do accidents occur? When do crimes occur? Does this vary spatially?”
Second, Charlotte Rochez queried:
“what your thoughts are on the potential for using crowd-sourced material, perhaps in a similar ways to that outlined in Graham, Massie and Feuerherm’s and Sikarskie’s essays…?”
Please do your best to incorporate these recommendations into your revised essay. According to the word count at the bottom of the WordPress editing window, your current essay is 4,789 words. In order to meet our obligations to the Press, your final resubmission must not exceed 5,000 words.