Visualizations and Historical Arguments (Theibault) Fall 2011
Visualizations and Historical Arguments (Fall 2011 version)
¶ 1 Leave a comment on paragraph 1 5 Visualizations in history can operate on two levels. On the one hand, any image that contributes to the theme of a historical work functions as a visualization. Though the popular phrase “a picture is worth a thousand words” is a relatively recent coinage, the idea that images can be an effective complement to or substitute for written description, narrative, or analysis is probably as old as writing itself. Illuminated manuscripts and incunabula incorporated images, some of which conveyed messages related to the text and some of which were mere adornments. By the late sixteenth century, linkage of image and print reached a kind of apotheosis with the publication of emblem books, in which each page consisted of an image, a motto, and a pithy verse that jointly communicated moral precepts. Historians have always made use of visualizations in this broad sense. Reproductions of pictures of the main biographical figures referenced in a book or other objects that figured prominently in the narrative appear in many historical works. Often the connection of these illustrations to the arguments of the book were implicit rather than explicit, but sometimes the text drew direct attention to elements of the pictures, so that the reader’s understanding was enhanced by close attention to the images. But when the term “visualization” is used today it more often refers to an image derived from processing information — often but not always statistical information — which presents that information more efficiently than regular text could. Visualizations of that variety have a long tradition. Three kinds of visualizations characterized even the most conventional nineteenth century political histories: maps, timelines, and dynastic charts. It is much easier and more informative to create a chart of lines of descent to the Kings of France than it is to describe the lineage in a paragraph of “begats.” Each of these forms of visualization acquired a distinct visual vocabulary that took time for readers to adapt to. The reality, if not the formal concept, of information density as a value was established. Maps showed the most elaborate evolution to their current form, but timelines also changed from simple sequential lists of events and dates to carefully managed visual spaces in which temporal relationships between events could be recognized by how far apart they appeared on the page.
¶ 2 Leave a comment on paragraph 2 0 The emergence of the social sciences in the nineteenth century and the ability to work with large data sets created demand for new ways of visualizing information beyond maps, timelines, and genealogical charts. Processed numerical information was best expressed in tables, charts, and graphs. Mathematics, natural sciences, and social sciences that employed statistics were at the forefront of the development of charts and graphs. History was a consumer, not a designer, of most of these new visualizations – and mostly a sparing consumer at that, since economic and social history lagged behind political history as an area of research. Simple charts and graphs like pie charts, line graphs, and histograms were not difficult to interpret and their visual conventions became part of what any ordinary reader would be expected to follow. As statistical analysis became more sophisticated, the visualizations that resulted became more and more central to the argument. In some cases, the visualization made interpretation possible. These success stories demonstrated the worth of statistical analysis and visualization. Perhaps the most notable example is John Snow’s map of the incidence of cholera in an 1854 London outbreak, which helped plot the source of the outbreak at a single water pump in the neighborhood.1 Snow’s cholera map showed that visualizations could serve as both narrative and analysis. Authors began to experiment with ways of using visual clues to tell complex stories about events, increasing the amount of information that could be conveyed in a small space and thereby overcoming the limitations of two-dimensions in print. A noteworthy example of innovative presentation was Charles Joseph Minard’s Carte Figurative des pertes successives en hommes de l’Armée Française dans la campagne de Russie 1812-1813 of 1869, which shows the advance and retreat of French troops in Russia on a scale map while showing the changing size of the force due to death and desertion through the thickness of the line representing the force.
¶ 3
Leave a comment on paragraph 3 0
 Figure 1: Carte Figurative
¶ 4 Leave a comment on paragraph 4 1 The conditions confronting the troops during the retreat are also illustrated by a timeline of winter temperatures graphically connected to the map-based chart. Though Minard was a civil engineer, not a historian, he was able to construct a very powerful narrative of the events of Napoleon’s march on a single page. Minard’s chart is often cited as a model example of information visualization because it is easy to understand, even for people with little background information on the topic or quantitative skills. The challenge for visualization is to be transparent, accurate, and information rich. Minard’s information rich visualizations set the standard for both transparency and accuracy in the kind of work that could be done before computerization.
¶ 5 Leave a comment on paragraph 5 3 As noted above, historians were mostly consumers of statistics-based visualizations from the social sciences rather than innovators in constructing new kinds of visualizations. The advent of “cliometrics” and Annaliste total history in the 1960s forced more historians to become conversant with quantitative methods. Though the Annaliste approach to total history predated widespread use of the computer, much of the first wave of social scientific history relied on statistical packages like SPSS and SAS to process large amounts of data. As Peter Novick has noted, this turn to quantification generated resistance from historians who sometimes did not have the background knowledge to understand the argument being put forward. As he pithily phrased it: “Historians who wanted to know the basis of Robert Fogel and Stanley Engermann’s conclusion were only moderately exploited were told that the answer was [Equation].”2 But, of course, Fogel and Engermann did not rely solely on equations. Their book was filled with tables and graphs that were supposed to carry the argument (and justify the equation) as well — forty-six charts in the main text and a whole supplementary volume on methods with still more charts. These tables and graphs could be as daunting as equations. The most determinedly quantitative works often had several pages of tables, most of which would be referenced in the text, but not always at the precise page that made the link between text and table most obvious. Instead of working as a driver of narrative, many of the tables and graphs produced in quantitative works of the 1960s, 1970s and 1980s sat inert on the page, functioning more like the biographical pictures included in early historical works than as an integral part of the argument. Toggling between explication and evidence slowed reading considerably, so much so that readers of quantitative histories of the era sometimes broke into two broad groups: those who read the text and assumed the charts and graphs confirmed what was said there and those who read the charts and graphs while paying scant regard to the text. To be sure, many more historians developed the ability to rapidly interpret a greater variety of statistical representations. It became possible to use a scatterplot with a line of best fit or a Lorenz curve comparing inequalities with a reasonable expectation that most readers would be persuaded by the results visible in the charts, without requiring significant textual explication. But most social histories continued to rely primarily on bar and line graphs as their most prominent visualizations. Many reasons have been put forward for the relative decline of social history since its heyday in the 1970s (the reactions against Time on the Cross figuring prominently in many of those explanations), but a failure of imagination in the application of visualizations in print works may have contributed to the decline.
¶ 6 Leave a comment on paragraph 6 2 While historians debated how to incorporate statistical methods into scholarship, statisticians were become more self-conscious about how results of analysis were being used. This attention to how quantitative information was presented first came to the attention of most humanities scholars with the publications of Edward Tufte in the 1980s. His three key works, The Visual Display of Quantitative Information (1983), Envisioning Information (1990) and Visual Explanations (1997) placed the aesthetics and explanatory power of graphs and charts under closer scrutiny.3 It was Tufte who was most responsible for renewing attention to Minard’s Carte Figurative. Tufte’s main target in these books was what he called “chartjunk,” unnecessary clutter and contrived images that made visualizations confusing and sometimes deliberately misleading. Chartjunk was mostly associated with news and business publications. A notorious example was a line graph in Time magazine in 1983, Diamonds Were a Girl’s Best Friend, which charted the price of a one-carat diamond, using a drawing of a fishnet-stockinged-leg of a woman to define the trend line. Historians, like social scientists writing for scholarly publications, tended to avoid visual embellishments of charts and graphs like that. But they did have to be attentive to ensuring that legends were clear enough that readers were not deceived by how information was displayed. Even accurate information can mislead if it is presented in a way that creates false visual cues. For example, inexperienced readers might need some guidance with a logarithmic chart so that they do not mistake an exponential change for a linear one. And sometimes, visualizations can be shaped to seem more conclusive than the underlying data actually warrant. For example, if a line graph showing differences ranging from 65% to 85% has its baseline set at 50% rather than zero, it leads people to see the differences in values as starker than they actually are. As the issue of how to best display quantitative information was becoming a greater concern in historical work, Tufte’s analysis resonated with humanists just as it did with business writers and journalists.
¶ 7 Leave a comment on paragraph 7 3 Visualizations are efficient stores of dense information, but they can also work as rhetoric. Whether they are primarily the former of the latter can depend on how much background information the reader brings to the visualization. The development of more complex visualizations has increased the gaps between expert and novice interpreters, which raises challenges for historians who seek the most effective visual approach. A good example of the challenge of finding the ideal system for visualizing can be seen in the maps of presidential elections that appear in almost any textbook of American history, permutations of which have been presented by Mark Newman, a physicist at the University of Michigan.4 To interpret the standard election map properly, one must know and be able to “read through” the peculiarities of the Electoral College and the distribution of population. For example, a superficial glance at the Electoral map for the 2008 election suggests an evenly divided country, rather than a comparatively easy victory for Obama. And if we look at the returns on a county rather than state basis, it looks as if McCain had a rather comfortable margin.
¶ 8
Leave a comment on paragraph 8 0
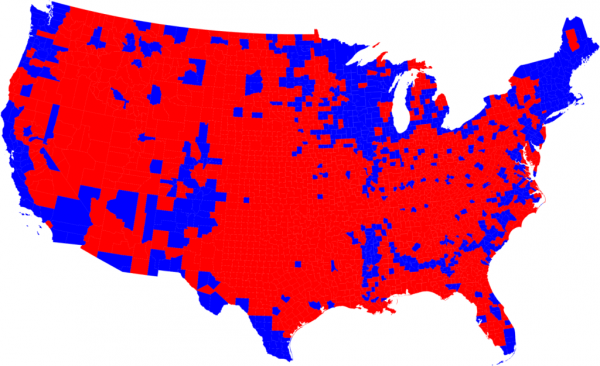 Figure 2: Electoral Map for the 2008 Election
¶ 9 Leave a comment on paragraph 9 0 Many times, such semi-misleading maps are good enough for the purposes of historians. It is easy enough for readers to see the number of Electoral votes listed for each state and to “adjust” our vision of the map to compensate, but in doing so, we lose some of the point of presenting the information in map form. The county level map is harder to make adjustments for, since we intuit that big cities have larger populations than rural counties, but do not have a simple way of estimating how big the differences are. There are simple visualizations, such as a cartogram, that can help make those adjustments for the reader. If the size of states are adjusted to reflect differences in the number of electoral votes, the much larger blue space on the map allows one to immediately perceive the magnitude of Obama’s victory. The cartogram of county-level results shows an even more dramatic contrast with the unadjusted map.
¶ 10
Leave a comment on paragraph 10 0
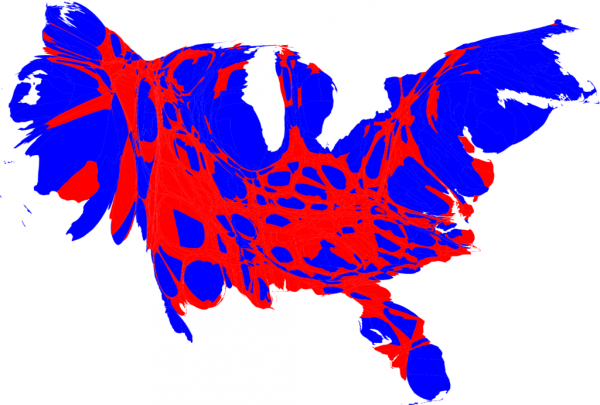 Figure 3: Cartogram of County-Level Results
¶ 11 Leave a comment on paragraph 11 0 Of course, using cartograms does not eliminate all problems of interpreting the election. Both Electoral maps and county-level results are presented in a winner-take-all fashion. We can tell from the map who won, but not how decisive the victory was in each state or region. A different visualization, a choropleth map where shadings of color show the magnitude of victory, can uncover that information. In a county level map of the election, we still see some regions of bright red or bright blue, where McCain or Obama received overwhelming support, but much of the country becomes a purplish middle-ground. An advantage of using choropleth maps for information density is that the scale of color contrast need not be linear, if you wish to highlight different thresholds of intensity. Finally, the information contained in choropleth maps can be combined with cartograms to increase the information density even more. The choice of which of these forms of visualization to use will depend partly on the author’s expectations of what readers already know and what interpretations they wish to highlight. The non-linear choropleth cartogram of county level results show that Obama gained great advantages in the major urban centers, which is easy to see if readers already have a general sense of where cities like New York, Chicago, and San Francisco are located. Unfortunately, the distortions of the cartogram when combined with the choropleth can also make the information harder rather than easier to interpret without a very high level of prior knowledge. Is the big blue island in the South urban Atlanta or a concentration of rural African-American counties in Alabama and Mississippi?
¶ 12
Leave a comment on paragraph 12 0
 Figure 4: Choropleth Map
¶ 13 Leave a comment on paragraph 13 0 It is not obvious, even when viewed next to a regular choropleth map. The challenge posed by the county level choropleth cartogram is indicative of how visualizations can transform historians’ practice. Is it hard to interpret because the format of combining cartogram and choropleth is unfamiliar? Most historians have probably encountered a choropleth map and a cartogram in a print history book or contemporary source in the course of their research, but probably have not encountered the two combined. Or is it hard to interpret because it makes unreasonable demands on the background information of the reader? The population of greater Atlanta is sufficiently larger than the population of the Mississippi delta that the big blue spot in the South probably represents Atlanta, even though the demands of the cartogram place it in about the same spot as one would expect to see the Mississippi delta.
¶ 15 Leave a comment on paragraph 15 0 As Peabody’s work shows, it is possible to use color as a visual cue in print texts, but it is generally prohibitively expensive. Online, color is both efficient and cost-free. A superb example of using color to highlight relationships in text is Ben Fry’s concordance of the six editions of Charles Darwin’s Origin of Species completed in his lifetime.7 The original text is represented by each sentence being compressed into a single line. The reader can scroll over each line to get a text box of the sentence. The additions in subsequent editions are represented by different colored lines. The colors allow one to quickly grasp, for example, that chapter four was most extensively revised in the third and fifth editions while chapter six was most extensively revised in the fourth edition. Dramatic changes are visible because of tiny lines of color. This same principle is taken up in the Wordseer project at the University of California, Berkeley. They have digitized a corpus of printed slave narratives and compressed each narrative to a single bar of a heat map. One can then search for words across all of the narratives and see how frequently they turn up in each of the paragraphs, represented by lines within each bar.8 Color, brightness, and lines and bars become powerful ways of making interpretive leaps about texts, so long as one has the background knowledge to understand the implications of the visualization.
¶ 16 Leave a comment on paragraph 16 1 Color coding is one way the web lends itself to deep information density. Another way unavailable to two-dimensional print is that information can be animated, adding time as another dimension of visualization. Just as a map can make 1 inch = 1 mile, an animated timeline can make 1 second = 1 year. Sometimes, that simple combination of animated map and timeline can create a powerful narrative without any text at all. A brilliant example of this is the animated map of the 2053 nuclear explosions between 1945 and 1998 created by Isao Hashimoto, which dramatically narrates the contours of the nuclear age.9
¶ 17 Leave a comment on paragraph 17 2 Aside from the title, there is no background information associated with the animation. The only text in the piece is in the legend, which emerges as each new nuclear power first explodes a device. Sound, not words, is used as a second way of highlighting the data points. Yet despite the absence of background information text, almost anyone watching the animation will come away with a deep understanding of the key features of the nuclear age. Only a modest background knowledge (such as knowing who the main antagonists in the Cold War were) makes the presentation of what might seem dry factoids not only informative, but moving. Other map-based animations show other ways of assembling information to make a larger argument. For example, Gareth Lloyd scraped the information in Wikipedia to show where the “events” of world history have taken place according to Wikipedia.10
¶ 18 Leave a comment on paragraph 18 1 This information is useful, not so much as a kind of world history, but as a way of analyzing historiography by showing how Western-centric the contributor base of Wikipedia appears to be. Another effective animation is Derek Williams’ presentation of the dates of the founding of post offices in the United States up to 1910.11 Though the object being presented is post offices, the animation is most informative as a story about settlement and population growth, accomplished entirely without words.
¶ 19 Leave a comment on paragraph 19 0 It is no coincidence that the three animations mentioned above base their visualizations on maps. Geo-spatial locating of information has been one of the richest areas of development in digital humanities. It is easy to imagine the cartograms and choropleth maps of presidential elections being animated to tell a story about changing voting patterns over the decades. Like Minard’s map of Napoleon’s march, the sites mentioned above were not created by professional historians, but by specialists in other fields working with historical data. But we are slowly starting to see complex visualizations based on maps emerging as part of a “geo-spatial turn” in the humanities.12 As part of Stanford’s Spatial History Project, online visualizations have been created to accompany Richard White’s recent book on the development of the trans-continental railroad.13 This project is particularly interesting for understanding the impact of digital humanities on current historical practice because it is directly associated with a print work and seems likely to serve as a template for future hybrid productions of print and digital. It is also closely aligned with a still more expansive set of visualizations from the Stanford Spatial History Project about the themes of the book collected under the heading Shaping the West.14 There are twenty-six different visualizations included at the site, sixteen of which are animated. Not unexpectedly, several of the animations are simple plotting of space and time like the animations described in the previous paragraph. But others complicate the visualization by layering information in innovative ways. For example, one visualization reframes shipping distances in California in terms not just of track length, but also time to delivery and cost. And even though the animations have been created as an accompaniment to an academic work, they offer an interactive opportunity to the reader that those other animations do not. Readers can customize the presentation of data to isolate issues of particular interest to them, rather than depending on the author to frame the question being answered. Interactive engagement with a visualization is yet another innovation made possible by digitization.
¶ 20 Leave a comment on paragraph 20 1 Undoubtedly the biggest advocate for the rhetorical power of statistical animations that incorporate interactive features is the Swedish statistician Hans Rosling. He has created an animation of life expectancy at birth and per capita GDP for all countries since 1800 to demonstrate the evolution of world health.15 One can “play” Rosling’s animation in a non-interactive mode to see the story he tells. Color coding differentiates countries in different parts of the world. And if one scrolls over the circles on the chart one can see which country each represents. Circles vary in size depending on the population of the country, and change in size over time in response to population growth, so the reasonably well informed can quickly locate major countries like China, India, and the United States even without mousing over the circles. There is deep layering of information that is easy to interpret, even without an extensive background. In videos where he talks about the data, Rosling shows that the information illustrates a dramatic narrative of the convergence of the world on higher levels of health and wealth, but the point come across perfectly clearly even without verbal accompaniment. Rosling draws on an extremely rich data base and readers are able to customize the display of information according to their own interests. One tab allows readers to orient the circles on a map of the world, rather than on two axes of a chart. Another allows readers to choose which country’s data to include or not include in the animation. If one wants to isolate countries from a single continent, or countries that start out a similar size, one can do so. One can also adjust the timeline to focus on narrower periods where crucial changes might be taking place, instead of having to go through the entire time span for “big picture” changes. Because of this option for customization, Rosling’s project both makes an argument that is explicit in the first animation one sees and provides the basis for further exploration by the reader of his or her own interests. While the kind of graphs used by Rosling were developed prior to the web, they posed real challenges of presentation and interpretation in the 2-D format of print. Animation increases their interpretive force dramatically.
¶ 21 Leave a comment on paragraph 21 0 While certainly innovative, the visualizations created by Rosling still conform to what historians might expect to see in scholarly work. They are certainly not so esoteric that historians have any trouble understanding them. But as historians ask more complex questions about the data they have assembled, the problem of how best to present the information requires more thought. In the Shaping the West site each visualization has an “about” or “help” tab that functions as a legend and guide to the information contained in the site. The visualizations are not self-explanatory. A particularly complex visualization links the geography of the railroads with a network diagram of the boards of directors and sources of capital for each. The “about” tab for that visualization includes its of statement about “How to Read” the graphic. Such “How to Read” statements recognize that the visual vocabulary of innovative sites may not be familiar enough to make an argument without further explication of methods. Much historical writing is implicitly or explicitly about network connections, but historians are less familiar with how social scientists have been visualizing networks than they are with standard statistical visualizations. The Mapping the Republic of Letters project at Stanford University shows how network visualizations can be used in historical work.16 It overlays a networked map of correspondents on the actual map of Europe, with each link in the visualization representing a letter sent between an author at one location and a reader at another. Although the network described at Mapping the Republic of Letters is personal rather than conceptual, concepts can be mapped too. The online prototype of visualizations of network relationships is Thinkmap’s Visual Thesaurus, which allows readers to move from node to node in pursuit of related concepts.17 The danger of the visualization scheme is that unless one figures out the nature of the relationships between nodes, following any single link can quickly get one lost in the thicket of concepts. Even when the concepts and relationships being illustrated are relatively straightforward, the task of visualizing it can prove complicated by the volume of connections being analyzed. The sheer density of nodes can make it hard to single out factors that might interest the reader as in the network visualization of those scholars who make up the “vizosphere,” the leading edge of discussion about the future of visualizations.18
¶ 22
Leave a comment on paragraph 22 0
 Figure 5: Vizosphere
¶ 23 Leave a comment on paragraph 23 0 Instead of a clear pattern of lines between sites, there is a barely differentiated blob of circles. In an effective network visualization, the location of nodes is not predetermined, but specified by the nature of the links between them. Remove one source of links from the analysis and the location of nodes may become different.
¶ 24 Leave a comment on paragraph 24 1 Innovative visualizations have entered the mainstream of online user experience in the professions and social sciences. Just as SPSS and SAS and later R were created to enable basic statistical analysis, programs like Gephi have been created to undertake network analysis. In the wake of Tufte’s work, numerous authors now write about information design, though again mostly targeted at a business and journalism audience. Every day, sites like Flowing Data highlight innovative uses of visualization to make new arguments, such as People MovIn, which illustrates migration flows between countries.19 It is clear from these sites that people are still expanding the realm of the possible in visualizing information. Looking over these visualizations, even when they are not explicitly historical, will give historians strategies for making more powerful arguments to complement, and sometimes even substitute for, text. But the task of building those arguments will have to include educating fellow historians about how to interpret visualizations. As noted above, it can be very difficult for the uninitiated historian to intuit relationships between entities in a network analysis when they are put into a visualization scheme. Yet networks are often at the center of questions of greatest interest to historians. To the extent that the difficulties in interpreting innovative visualizations like interactive network diagrams are caused by a simple lack of familiarity with them, they can be overcome by building more such sites. To the extent that the are caused by a lack of background knowledge to understand the cues, creators of such sites will have to learn to build new ways of incorporating that background information as economically in the use of text as possible. In either case, at some point historians will have to accustom themselves to “reading” network diagrams as adeptly as they read maps or scatterplots.
¶ 25 Leave a comment on paragraph 25 0 About the author: John Theibault is Director of the South Jersey Center for Digital Humanities @ Stockton College. His training is in the history of Early Modern Europe about which he has written two books. He is currently engaged in trying to visualize historiographical connections and social scientific methods employed in local histories of Early Modern Europe written since the 1960s.
- ¶ 26 Leave a comment on paragraph 26 0
- Steven Johnson, The Ghost Map (New York, 2006) ↩
- Peter Novick, That Noble Dream (Cambridge, 1988) p. 588. ↩
- Edward Tufte, The Visual Display of Quantitative Information (Cheshire, CT, 1983), Edward Tufte, Envisioning Information (Cheshire, CT, 1990), Edward Tufte, Visual Explanations (Cheshire, CT, 1997) ↩
- http://www-personal.umich.edu/~mejn/election/2008/ ↩
- http://whitneyannetrettien.com/thesis/ ↩
- Elizabeth Peabody, Universal History: Arranged to Illustrate Bem’s Charts of Chrnology (New York, 1859), referred from http://beineckeroom26.library.yale.edu/2011/09/02/visualizing-history/ ↩
- http://benfry.com/traces/ ↩
- http://bebop.berkeley.edu/wordseer/heatmap.php?words=slave;filter=all&unit=sentences ↩
- http://www.ctbto.org/specials/1945-1998-by-isao-hashimoto/ ↩
- http://www.ragtag.info/2011/feb/2/history-world-100-seconds/ ↩
- http://vimeo.com/27376376 ↩
- http://spatial.scholarslab.org/spatial-turn/ ↩
- Richard White, Railroaded (New York, 2011) and http://www.stanford.edu/group/spatialhistory/cgi-bin/site/viz.php?id=341&project_id=0 ↩
- http://www.stanford.edu/group/spatialhistory/cgi-bin/site/project.php?id=997 ↩
- http://www.gapminder.org/world/ ↩
- https://republicofletters.stanford.edu/#maps ↩
- http://www.visualthesaurus.com/ ↩
- http://www.visualizing.org/full-screen/29391 ↩
- http://peoplemov.in/ ↩

Oops. Figure should be “County-level Results for the 2008 Election”
I could also include a standard Electoral Map of the States.
This article is at its strongest–and invaluable–in its discussion of mapping.
actually, i would say the opposite. historians are probably as or not more comfortable with maps than other complex (and especially multivariate) visualization. it’s the scatter plots and tree diagrams and representations of that nature that can be downright frightening to those who aren’t familiar with them. to explain how they are useful and necessary is a worthy exercise.
it might also be emphasized that making sense of visualizations of any sort necessarily (to some extent at least) entails understanding the principles of graphic design in the sense that it gives us a vocabulary to discuss why something works or doesn’t as a piece of visual communication. it’s hard to critique the value and meaning of the data behind or within the visualization if one is unclear about how deliberately the different elements are interacting with each other.
Quite a dense essay. I’ve clearly been reading too many student papers because I kept looking for a thesis, as some of my comments show. I do see the thread of argument: historians have supplemented their work with illustrations; digital visualizations are different, both from illustrations and from the displays of data of the cliometricians. As a reader, I need some help, though.
I found this essay exciting and inspirational. I would like to see other graduates and indeed undergraduates reading this.
I like this essay because it surveys some of the latest attempts at “processing” visualizations. I am not sure what the thesis is exactly, and would recommend that Theibault place his focus on how historians mediate visual information, from the Annales school to today, but with a special focus perhaps on mediation of visual images in digital form. Digital processing is creating an entirely new entity or class of visualizations with which we are unfamiliar, that seems to me the main issue here. We might explore what the components of these new developments are.
This essay could be sharpened by addressing the issue more throughly in the text and notes–too much seems missing here. Ayers’ “cinematic maps” for example. Ayers spoke about this here at Nebraska in 2006 and has written about these in the recent edited volume on Spatial Humanities. David Staley’s book on visualization in history should be consulted and cited. There is a broader literature on data visualization in history that Theibault might work into this essay.
I find this article very useful as a survey of certain threads in mapping and visualization, but agree that the author should consider a revision that strengthens the thesis and brings it into play much earlier.
This essay uses a number of very good examples and makes some important points about the ability of historians to read the visualizations their colleagues are being to produce. I would like to see this argument strengthened by a more explicit discussion of the ethics of visualization — perhaps in relation to the ethics of data. What do we as historians need to include in our visualizations (or explanatory texts) to make these images credible and critiquable?
In our invitation to revise & resubmit your essay, we wrote:
We concur with the valuable public comments garnered by this essay as well as your own responses to them. We especially support the recommendations to:
• tighten the essay’s structure and strengthen its thesis by introducing it early and referring to it often.
• include more screenshots and images (esp. illustrating points made in what is now the second half of the essay).
• reference the broader literature on data visualization in history (See William G. Thomas’s comment on the whole page, and Tim Burke’s comment attached to paragraph 5, where he writes, in part: “There’s one sense in which the story of visualization and history is too small as this essay tells it (Grafton’s work on the history of the timeline might be one example of how the story could grow and deepen both chronologically and across various contexts of historical production) and too big (in that visualization is provided as a key component of certain recent historiographical episodes).”
• highlight connections with other essays in the volume, most notably that by Gibbs and Owens.
Please do your best to incorporate these recommendations into your revised essay. According to the word count at the bottom of the WordPress editing window, your current essay is 5,019 words. In order to meet our obligations to the Press, your final resubmission must be reduced to 5,000 words.